This blog is essentially a lesson in Statistics 101 — one that you won’t see in any Statistics textbook. Lesson One in most statistics courses starts with means and medians, while Lesson Two moves on to standard deviations. This blog does almost the same, but starts with a question that many people are asking: “Are men smarter than women?”
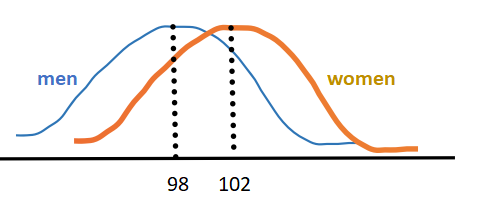
Suppose, just for the sake of argument, that women have slightly higher IQs than men, say 102 to 98 on average. The bell-shaped curves might look like this, with the women’s curve slightly to the right of the men’s.
But then next, suppose that men’s IQs are more variable that women’s, that is, they are spread out among a wider range than women’s, which are more concentrated around the average. Here’s what that graphs would look like:
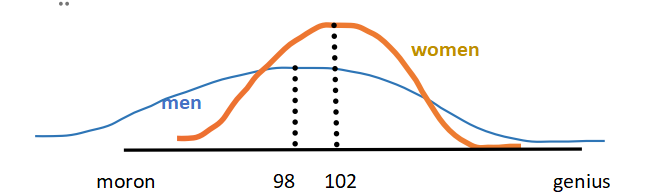
The interesting thing about this graph is the fact that the average woman is higher than the average man, still 102 to 98. However, the variability puts just a few men on the far right in the genius category, while there are fewer genius women. The great geniuses in history –Einstein, Mozart, etc. — have mostly been men.
At the same time, there are a lot more men on the extreme left end of the graph. This means that there are a lot more morons and extremely stupid men than women.
This ‘variability hypothesis’, first proposed by Charles Darwin himself, followed by many educational researchers like Havelock Ellis and Edward Thorndike, has been tested over and over during the past century or so, with mixed results. The variability may depend on the trait (like IQ) being tested, and a host of other variables. At least one can say that in some areas, men have shown a higher variability (even with the same mean) as women. So the statistical model I have outlined may be true in measuring some traits, such as some types of intelligence (assuming that we have multiple intelligences).
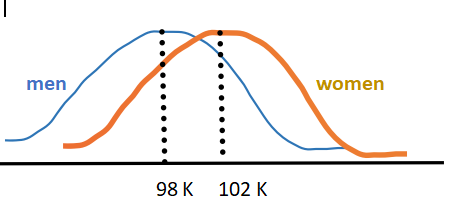
For this next example, I find it easier to talk about financial income rather than IQ. So, using the same graph as we started with, assume that 50% of women make 102 K or more, while 50% of men make 98 K or more. That’s the definition of median; a median of 98 tells you that 50% of men make 98K or more.
In real life, however, there are just a few people — almost all men — whose billion-dollar incomes distort the graph. Suppose that we add several billion dollars to the very richest men, while the lower 50% remain the same. [That is precisely what has happened over the past decade.] That is, the left side of the male graph doesn’t change, but the right side extends much farther to the right, to reflect those few billionaires.
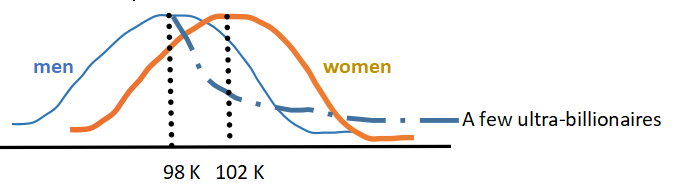
The new dotted line shows the left side of the graph unchanged, as 50% of men still make under 98 K. The median income for men is still 98 K.
However, adding a lot of money to a few billionaire men skews the right half of the graph further to the right. That means that the total amount of money made by men may have increased to the point where it is greater than the total for women.
The mean (per capita) income is the total income divided by the number of people (assuming an equal number of men and women), so if men make a greater total income, then the mean per capita income for men has surpassed that of women.
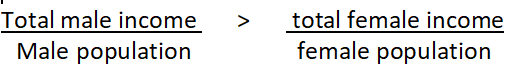
Therefore, while the median income remains greater for women (102 K > 98 K), the mean income is now greater for men.
This could happen to IQ scores as well, if just a few ultra-genius men skewed the graph so that women have a higher median IQ, while the men have a higher mean IQ. You could still have median IQs of 98 and 102, but the few male ultra-geniuses could raise the mean male IQ above women’s 102.
In summary, differing types of statistical analysis may show that most women are as smart or smarter than most men, but that there might still be a lot more male geniuses and/or morons than women.